
Honestly, I’ll put it out there that when it comes to reverse engineering binaries and looking at all that assembly, I’m most definitely uber-n00b. I am no expert at programming by any measure at all, but I do like figuring software out. Just like in looking at pcaps, if you understand how Wireshark works, you can go far even if you don’t yet understand networking. So it is with reverse engineering. I find you can go backwards and learn Radare and, from that as the starting point, work your way forward into actually, successfully reversing binaries.
Unfortunately, my experience with Radare is that it really needs to be done from a Linux environment. Radare in Windows or in Windows Subsystem for Linux works fine for static analysis, but Radare in debug mode requires an actual, live Linux environment. Debug mode is necessary for passing parameters to the file and modifying the file while it is running. With that said, if we actually are running an unknown binary, we would not want to run that on a host system regardless. That should be sequestered in a virtual machine (VM) where any damages it could cause are contained within the VM itself. If you don’t have a Linux VM set up yet, check out the Setting up a VM blog tag. If you prefer to not run in a VM, I can attest that yard sales and eBay are great resources for finding cheap tosser computers that you can reformat in your spare time and hose in your fun times.
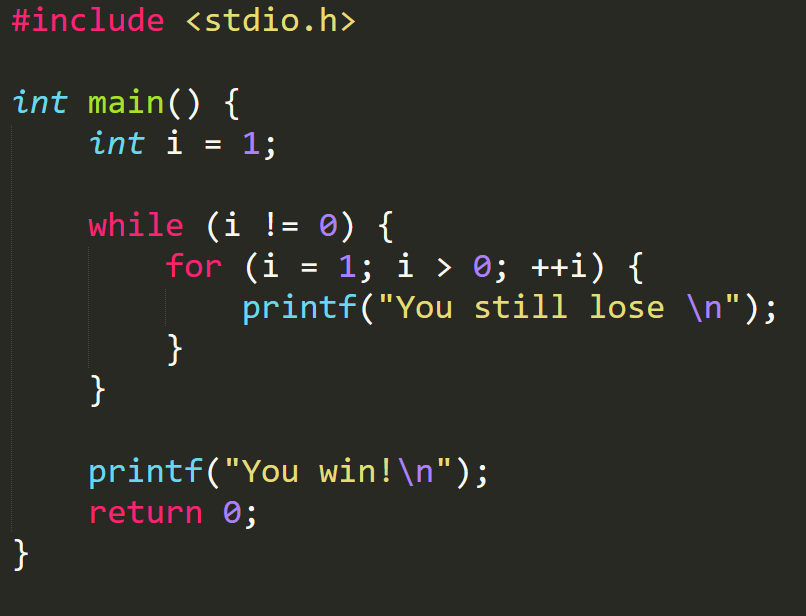
This is a very simple program, named simple, written in C. It creates a variable i and gives it a value of 1. It then says, while i does not equal 0, print the losing statement and add 1 to i. If by chance i ever does equal 0, the loop ends and the winning statement is printed. As long as the program keeps adding 1 to i, it is going to print the losing statement until we either force it to stop by pressing Control+C or a thunderstorm happens to pass by and knock the power out and kill this stupid program. We will never win.
Normally, we probably won’t have access to the source code, but for now we do just because it makes it easier to try to visualize things. It can be very useful to be able to look at the source code alongside the assembly, especially when assembly still looks alien. Other tools like Ghidra are beyond the scope of this blog post, but as an example Ghidra will let you decompile the program to give you something a bit more legible than assembly to look at for a side-by-side comparison.
Ghidra shows the assembly alongside the decompiled code—
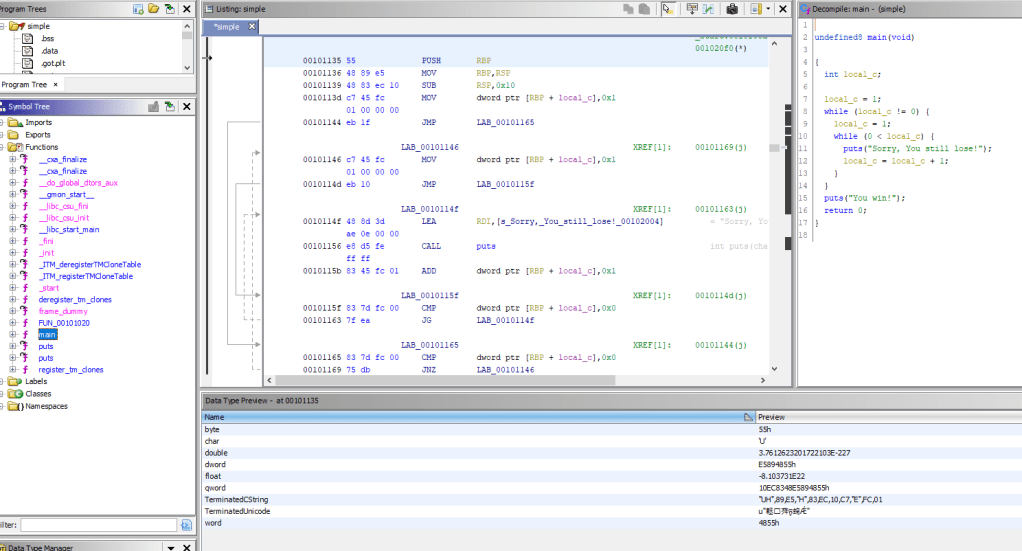
—while Radare just shows the assembly:
If you do want to learn more about Ghidra, check out wolfshirtz’ blog post.
To start analyzing a program with Radare, start with r2 -d. Note that we are actually running the file, so be certain that you are operating in a safe, sequestered environment, like a VM. -d signifies debug mode, which is necessary for passing parameters. In this particular example, there are no parameters to pass, so we simply r2 -d simple. (NOTE: To be able to run simple in debug mode, executable permissions must be granted using chmod +x ./simple. This grants permission for simple to run, so be very sure to be operating in a VM!)
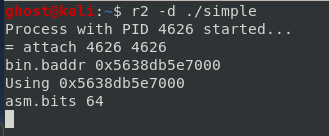
At this point, all we’ve done is load simple into memory, but nothing has run yet.
HELP
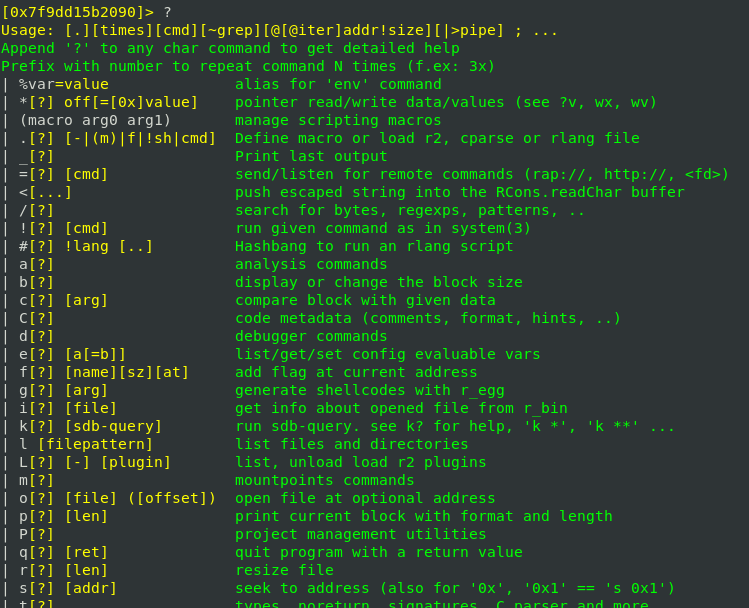
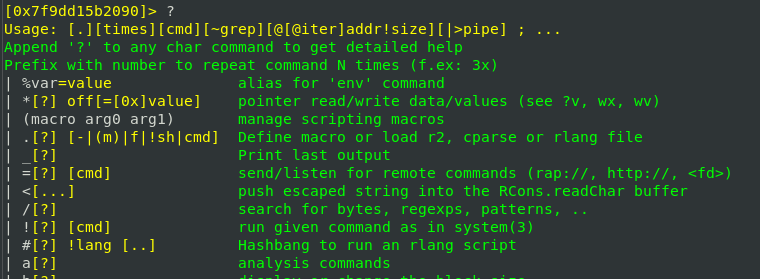
Before we go any further, one of the beautiful things about Radare is the help system. It looks extremely intimidating when you first start out, but once you get past the wall of text, it really is very quick and easy to navigate and sure beats trying to read through many pages. Simply typing ? will open the top-level help document.
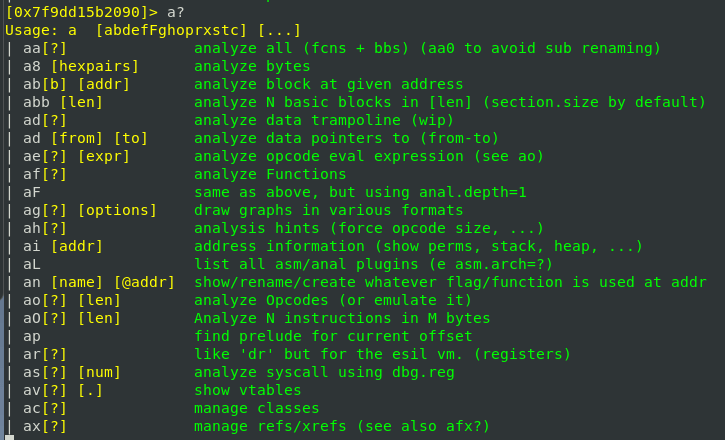
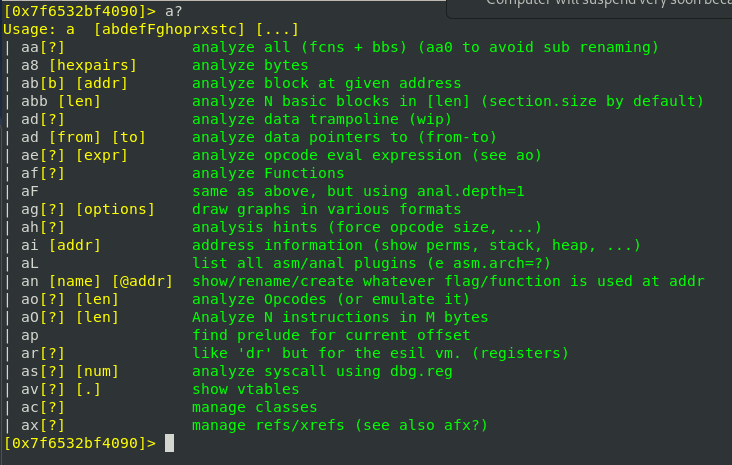
Every command is simply one character. As an example, we see the character a is used for analysis commands. We can type a? to get further help on analysis commands:
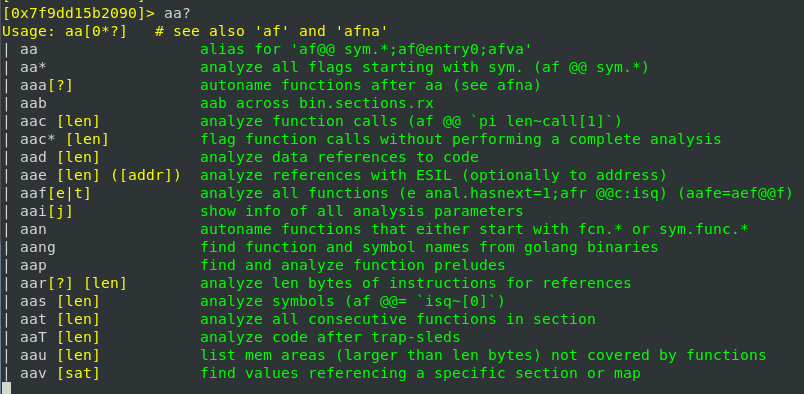
It looks like aa is for analyze all, and the trailing question mark denotes that there is a further level of help. Analyze all sounds interesting, so let’s check out aa?:
There’s an aaa, so let’s keep going down the line and check out what aaa? says:
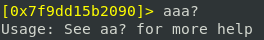
That’s not terribly helpful, though it gives us another command to try. When I was starting out, this is the exact process I used to get familiar with the different commands. As you look through these help screens, each character references a certain topic, so you can start generalizing as you get more familiar. But in this case, the recommendation is to see aa? for more help, so let’s go through this step-by-step:
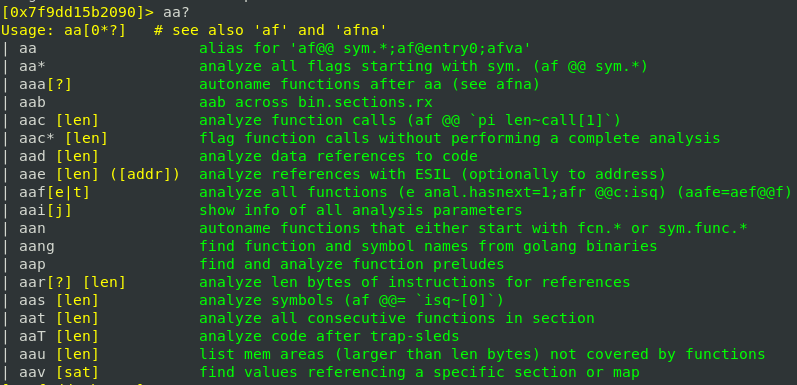
It says for aaa that it autonames functions after aa — see afna.
? reveals that a is for analysis commands:
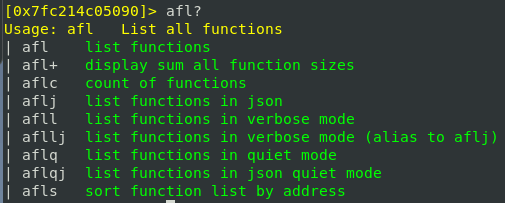
a? reveals the a-level commands, with af as analyze functions:
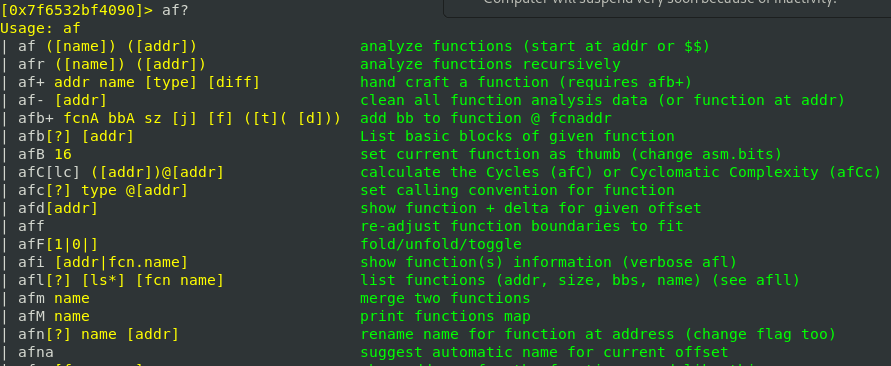
af? reveals the af-level commands, noting afn will rename functions, as well as saying afna will automatically suggest names as well.
Admittedly, that probably does not mean very much yet, and that really isn’t all that important. Checking the help for every command we type is important—the help statements are very short, and our goal is to become familiar with them. What these commands are doing is trying to make things more readable by having Radare name functions for us so we can more easily recognize them as we browse through the code.
As an example, the first command I use after aaa is afl to analyze function list—to list the various functions in the code. The following screenshot shows what happens if we run afl without doing aaa first—nothing, as we haven’t created the function names—to what it looks like after running afl.
This is afl:
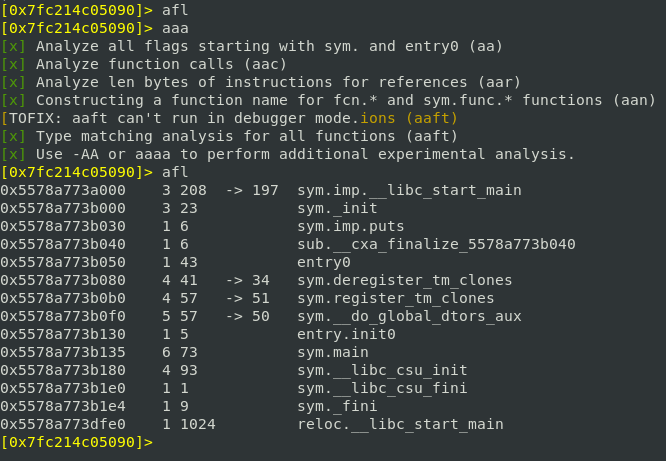
The hexadecimal numbers we see on the left are essentially line numbers (they’re really memory locations, but calling them line numbers may help simplify things while we’re new). The yellow hexadecimal number wrapped in [] is our command prompt, which is letting us know which line number we are on in the program. The white hexadecimal numbers on the left without [] are references letting us know on which line the different functions start. What we see in the far right column is a list of the newly created function names. For example, in this screenshot, if we wanted to look at the function called main, it starts on line number 0x5578a773b135.
Many of these functions are rabbit holes we can get lost in. There is almost always a main function of a program worth investigating. Also keep your eyes open for functions with interesting names to clue you in that they could be useful. Once you’ve seen enough binaries, you tend to gloss over most of the imported functions like sym.imp.puts or sym.imp.__libc_start_main and recognize what the main function is and what other functions are custom-created for each program. Those are ones worth looking at closely.
SEEKING
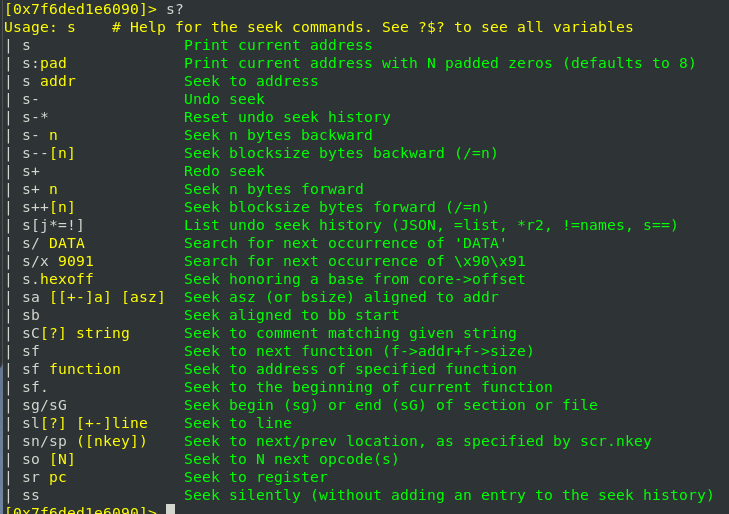
So, if we want to look at the main function, we want to seek it with the s command. Again, as we run these commands the first time, check out the help statements as well.

We can look at s? to further break down the s command:
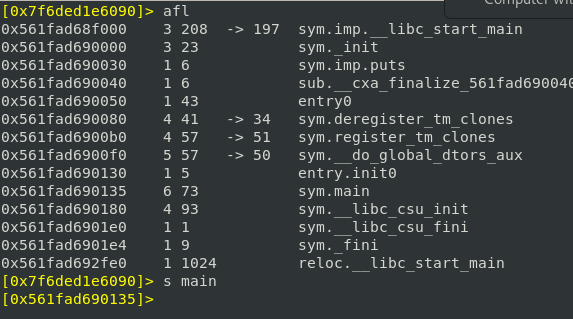
In order to look at the main function, type s main and take note of our yellow line number prompts before and after we seek.
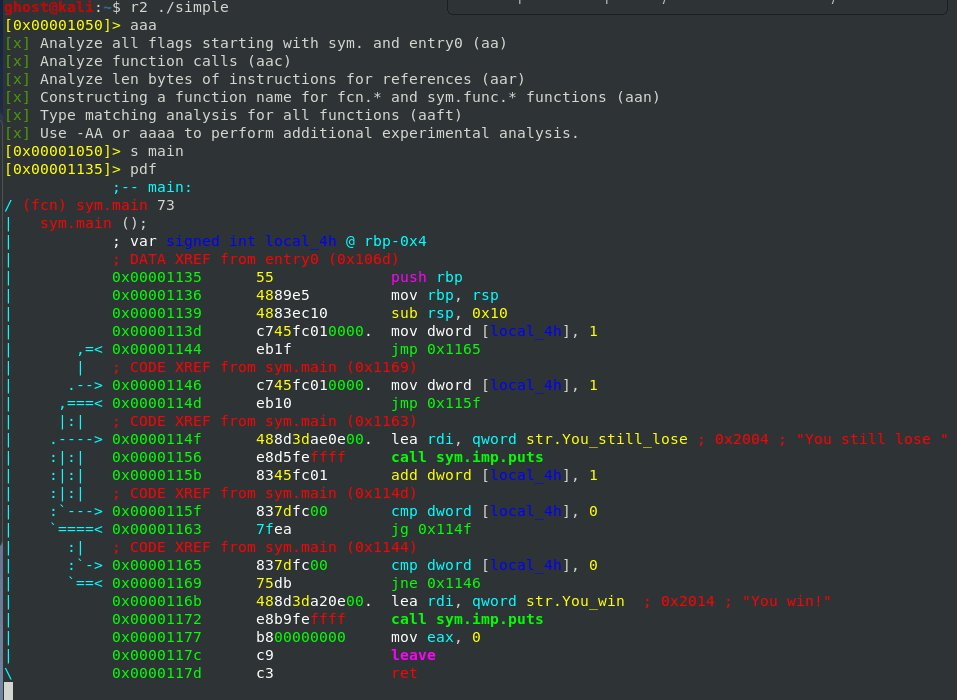
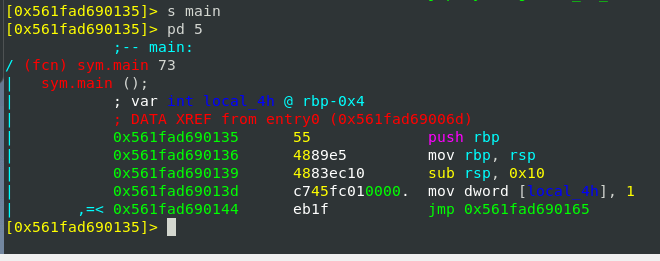
And now that we are at the start of the main function, we can use the command pdf to print the entire function to the screen. The function may very well be more than can fit on the screen, so we can alternatively print in smaller bites, such as pd 5 to display just 5 lines:
ASSEMBLY

Looking at the displayed function, we again see on the left the hexadecimal memory locations, or line numbers, of each part of the function. On the far right column, we see the assembly instructions. Tutorials Point has a wonderful assembly tutorial for deep diving into all the commands as you go along. Sometimes a chart works far better, though.
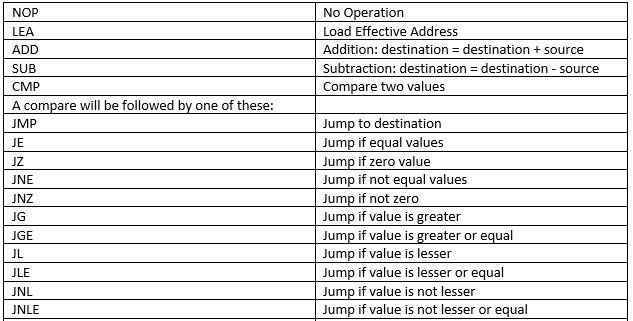
Some basic assembly commands:
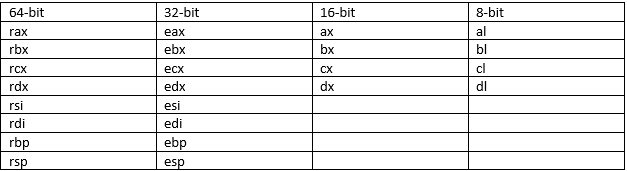
The point of this blog is not to make you an expert at understanding how assembly works—just to give you an idea of how to read it. With that in mind, it is worth knowing there are registers, which are essentially special memory locations reserved for volatile purposes—special locations where data will be manipulated and, rather than having to know which hexadecimal line number we need to reference it, we will instead have handy abbreviations we can reference instead.
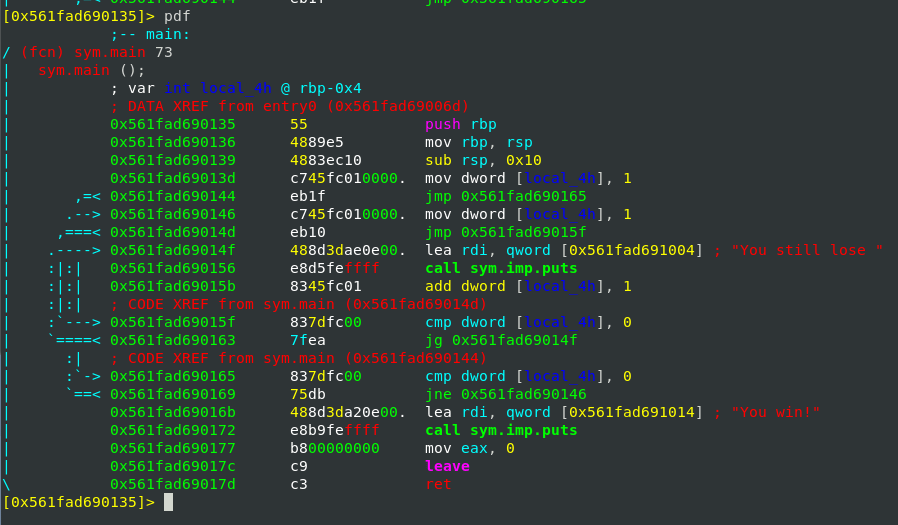
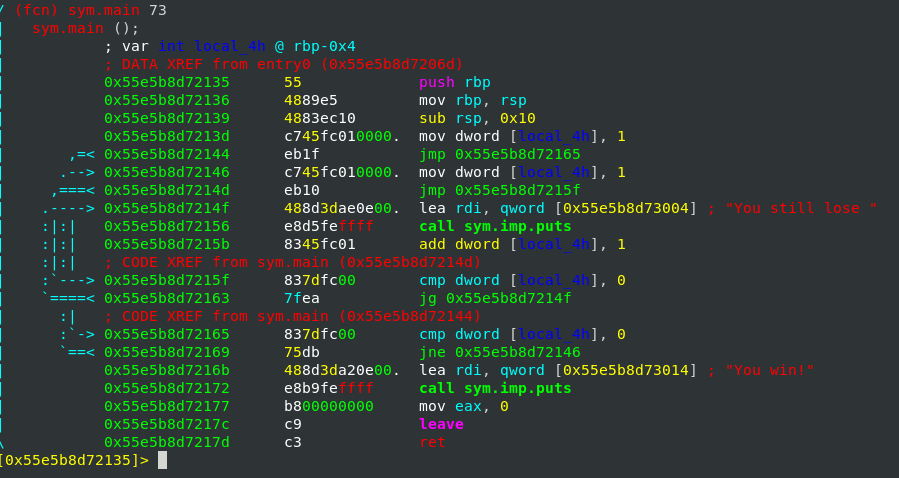
So, if we take a look at our function again, we can breeze through a brief explanation of what is going on:
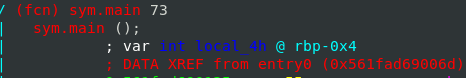
This is telling us that this function has a variable. Radare doesn’t know what variable name the programmer gave it, so it’s just assigning the name local_4h, and it is going to be stored at rbp-0x4, which is wherever the register rbp is and -4 from there. If we ever need to look to see what value that variable has, that is where we need to look.
Looking down to the next lines:
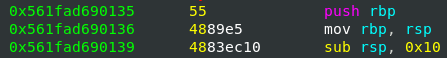
These lines are not terribly useful to us at this point, but this is memory management. We can see the register rbp is going to be used, and that whatever is in the register rsp is going to be moved into rbp, and then subtract 0x10 from rsp.
If it’s easier to grok, this would be a simple pseudocode for what the registers are doing:
rbp
rbp = rsp
rsp = rsp - 0x10
We may not understand the why or the what of what’s going on, and the why is certainly beyond the scope here, but we can see the what.
This next line—

—is saying that we are moving the value of 1 into the variable local_4h. Don’t worry about the dword bit; that is just assigning a value to the length of the data being stored. All we really need to know is that we’re seeing local_4h = 1.
Our next line, 0x561fad690144:
This is a simple unconditional jump: jmp 0x561fad690165. This means the next line of code that the program is going to run does not follow sequential order but instead will jump to 0x561fad690165. Radare plays nice with us as well and if you follow the blue arrows on the left, there is an arrow going from this jump statement to the destination, so you don’t need to strain your eyes comparing hexadecimal line numbers.
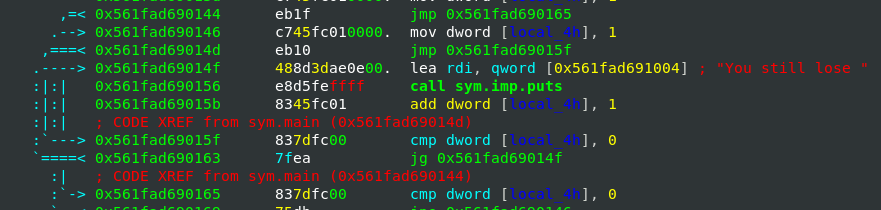
If we take a look at the line 0x561fad690165 that we jump to, we see this:

Compare local_4h and the value 0. We know local_4h does not equal 0 because we just saw it assigned a value of 1 two screenshots ago. If there is a compare statement, there should be a statement that immediately follows the compare that contains some sort of instruction. Our next statement at 0x561fad690169 says jne 0x561fad690146. If we check the cheat sheet above, we can see JNE means jump not equal. So if local_4h does not equal 0, we are going to jump to 0x561fad690169. If local_4h actually does have a value of 0, the program will continue to the next line where it says we win. Unfortunately, local_4h does not equal 0, so we do not get to go to the winning statement and instead jump to 0x561fad690146.
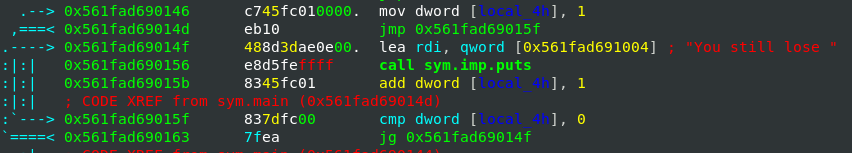
At line 0x561fad690146 the program is redundant and moves the value of 1 back into local_4h. On the next line [0x561fad69014d] is another unconditional jump sending us to line 0x561fad69015f, where we are again running a compare between local_4h and 0. The next line 0x561fad690163 says jump if greater (JG)—and local_4h was just re-given the value of 1, which is higher than 0—so we jump to 0x561fad69014f, where it prints that depressing “You still lose” statement. Two lines below, we see 1 getting added to local_4h again, so now local_4h has a value of 2. 0x561fad69015f is again comparing local_4h to 0, and if local_4h is greater, it jumps us back to the “You still lose” statement, incrementing local_4h higher, and cycling through ad infinitum to print forever that we are still losing.
If we take a look at our source code again and compare that to what we see in this function, hopefully we can start to see where the similarities lie:


EDITING
So far, while we’ve been looking at the program, the program hasn’t really run yet. It’s still paused at the very beginning. However, it really does look as though, if we could just make some slight alterations to the program, we might be able to win!
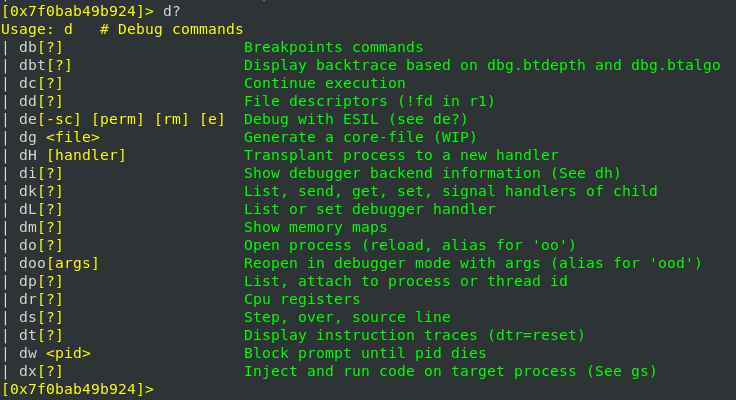
Now we get to see the fun of using Radare in debug mode. If we type d?, we will pull up the debug help menu.
If we type dc for debug continue, this will run the program until either the next natural pause for input or break point. In our case, this is running forever.
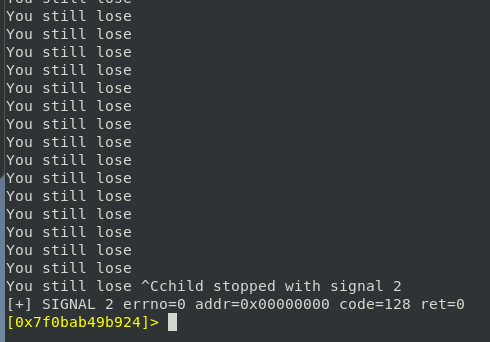
This continued until I hit Control+C to break it. Unfortunately, at this point I had quit the program to work on something else and reopening it meant all new line numbers.
Now that we have correct line numbers to reference, let’s set a break point at that jump if greater statement on line 0x55e5b8d72163, as well as a break point at the other compare result jne, since we have two different conditionals we need to get past.
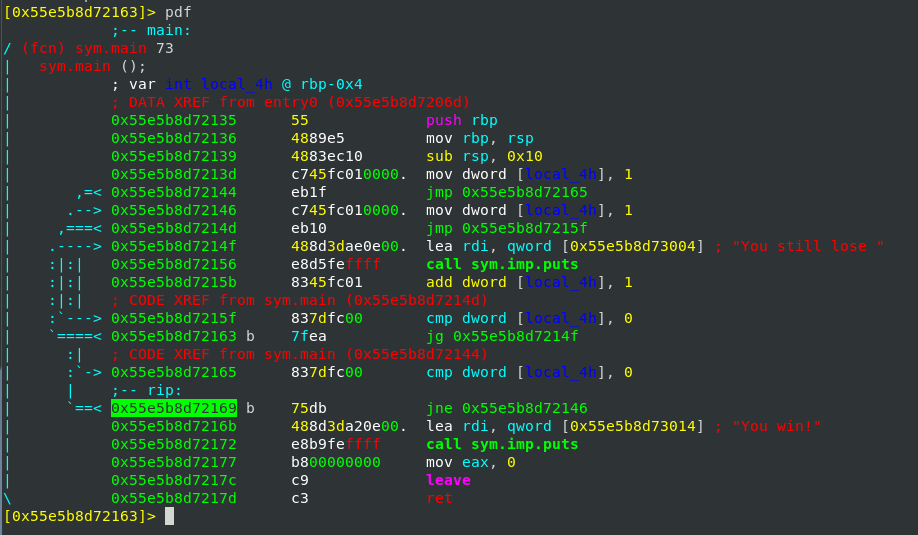
If we again print the function (pdf), we can see both lines have been marked with a ‘b‘ to denote a break point.
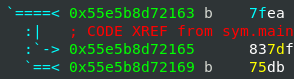
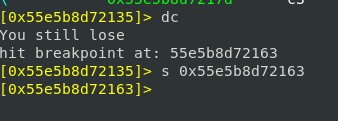
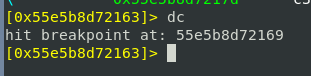
Now if we hit dc to debug continue, instead of running forever, the program pauses at our break point.
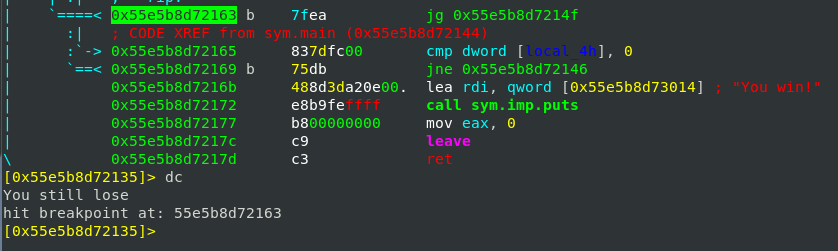
Two things to take note of: First, line 0x55e5b8d72163 is highlighted green. That highlighting is telling us where the program is paused at. Second, our prompt still says 0x55e5b8d72135. If I try editing now, I will edit the line I am currently at and not the line I’m intending to edit. I’ve done this many times, and I’m sure I will do it many more times as well. Since I want to edit the line where our break point is, I should seek (s) that line first so that my prompt matches.

Now that we are at our break point and seeked to the proper line number as well, we have a number of things we can try. Let’s take a look at the wao? command.
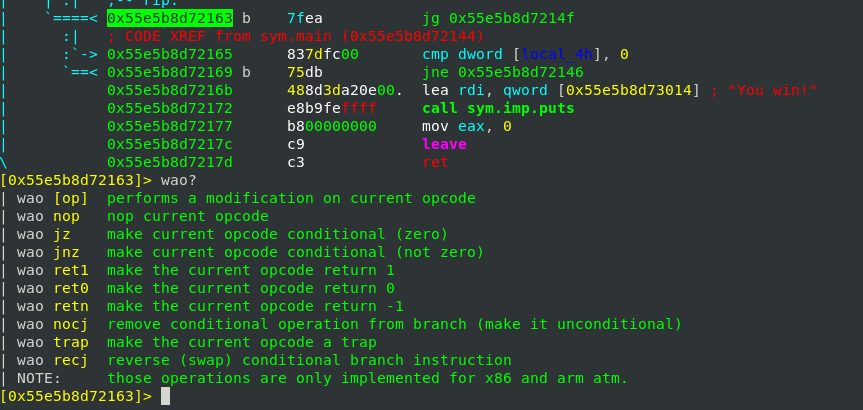
Wao will allow us to edit the current opcode, meaning the line we are showing in our prompt. Since the opcode currently reads JG (jump if greater) and we already know that will send us to the infinite loser statements, wao recj to reverse the conditional branch might be interesting:
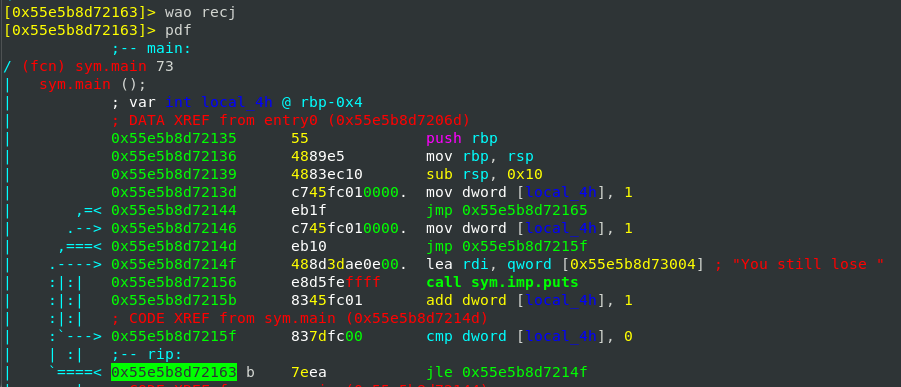
If we now print our function (pdf), take a look at our first break point. The conditional has been switched from JG (jump if greater) to jle (jump if less or equal). Since local_4h is greater than 0, now if we dc (debug continue) we should skip that jump to the loser statement and instead hit our next break point. Let’s take a look.
We’ve passed the first checkpoint! Now if we print our function (pdf) again, we can see that the program has indeed reached the second compare. Also note that while the second break point is highlighted to show where the program is actually paused at, our prompt again still shows us at the first break point, so we will need to s (seek) to the second break point to be able to modify that line.
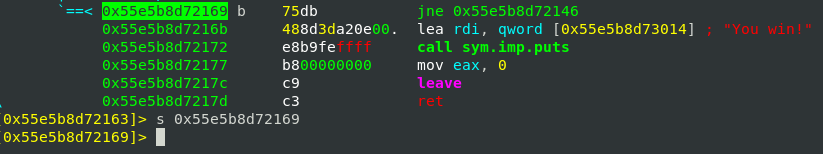
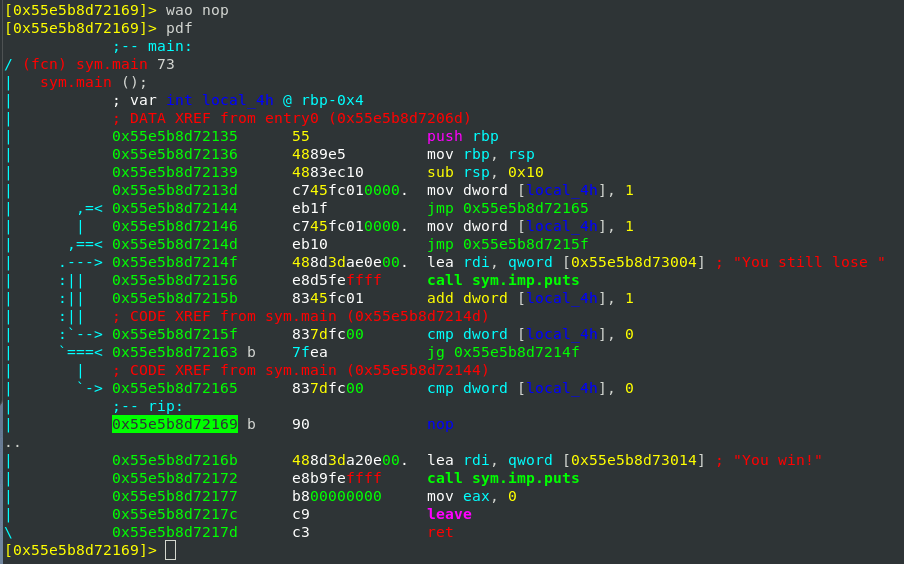
Now that we have paused and seeked to 0x55e5b8d72169, we are free to edit this JNE (jump if not equal). We could very easily do another wao recj to change this into a JE (jump if equal), or we could do a famous wao nop—change it into a no operation, i.e. this line will now do nothing at all and the program will just happily skip by.
And dc (debug continue) for the moment of truth!
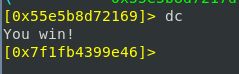
Without really understanding the underlying assembly—just enough to skim the basics and how to use Radare—we’ve just successfully hacked to win an unwinnable game!
What follows is a simple cheat sheet of a few Radare commands, some of which we have covered and a few which we have not, but I find these to be the core commands I’ve used in reversing binaries thus far.
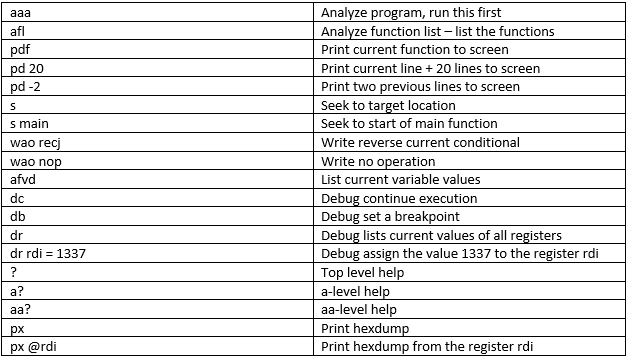
I hope at this point you find yourself comfortable enough to try to play around on your own! Happy hacking!
