
Opening Wireshark for the first time looks far more daunting than it really needs to be. Even if you are completely new, simply being aware of how to use Wireshark can greatly help in uncovering what you are looking for in a pcap. Keep in mind pcaps present a virtual ton of information and Wireshark presents the tools to capture and present all of that. When it doubt, right click something and look at your options.
A Fancy Spreadsheet

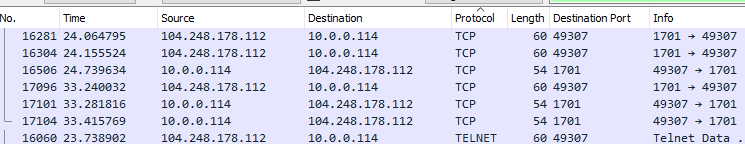
This is the basic Wireshark window. The section you see in blue with columns No., Time, Source, Destination, Protocol, Length, Info, is a spreadsheet. You can click any of the column titles to sort by that column. If you’re more comfortable in a spreadsheet program, you can export whatever is in that pane into a csv file and open it in your favorite spreadsheet program.
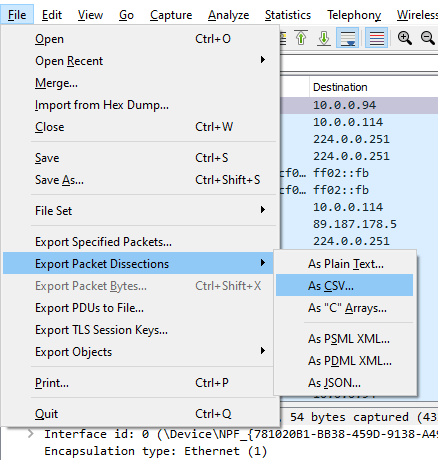
Take note of the Packet Range options — Captured versus Displayed. Captured will convert those columns for the entire pcap into a csv. Displayed will convert only what’s visible with your current filters into a csv. More on filters later.
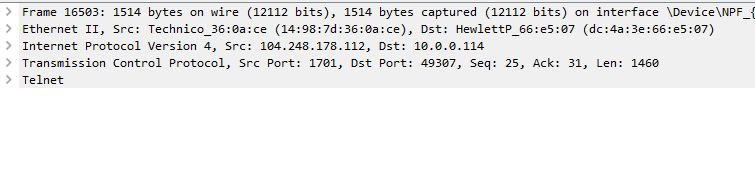
When I was starting out, I was absolutely just sorting by the Protocol column and especially the Info column and just browsing through and scanning what was written there, flicking the scroll wheel to move down, and praying to the pcap gods. At my school, we called it flicking to win. There is a lot of information in the Info column.
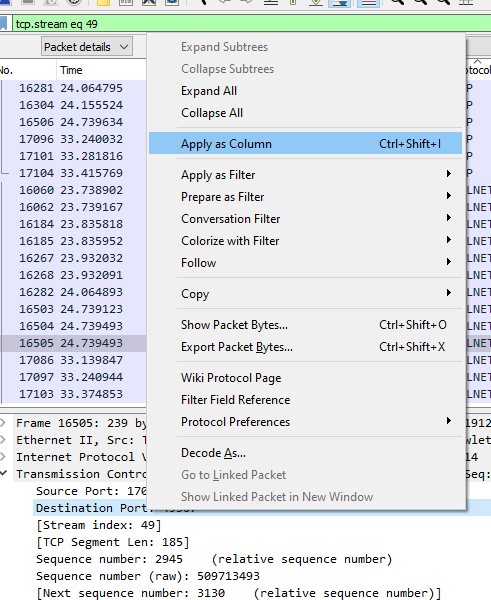
Following The Stream
If you find something that looks interesting, right click, follow → TCP stream or right click, follow → HTTP stream and it will show you a pop-up with details of that particular conversation.
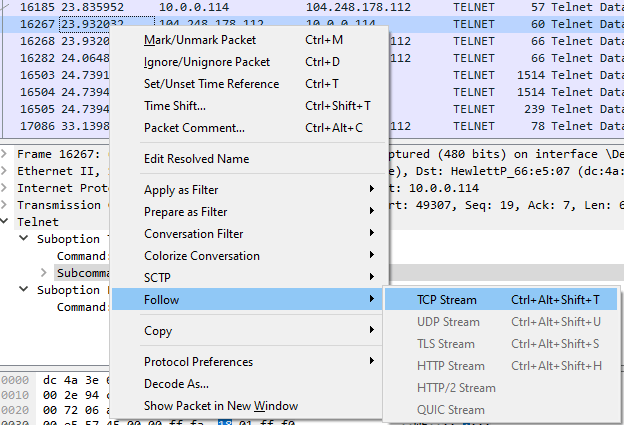
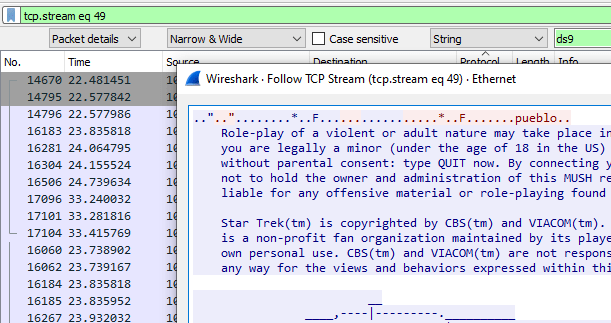
Notice the filter bar has been auto-populated with tcp.stream eq 49. You will have to X that out to go back to an unfiltered spreadsheet. That is also an example of what a filter looks like, but our pop-up now displays the contents of the entire stream conversation. There can be very interesting things to find doing this.
Adding Columns
This pane of the Wireshark window holds a plethora of more detailed information not necessarily included in the spreadsheet pane (and thus won’t be included if we export to csv either).
As we browse through this pane, note all of the > on the far left. Those are tree branches that can be opened. Once you reach a level that does not have a >, that is something we can right click and apply as a new column to appear in the spreadsheet portion.
We can add virtually anything as a column to appear in the spreadsheet pane, then can click the column headers to sort by that new column.
Searching
You can activate searches by pressing the magnifying glass icon or hitting Control+F.

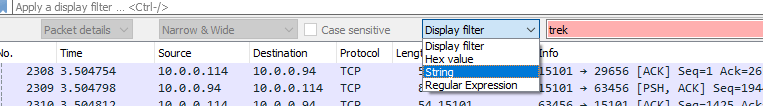
Keep in mind where it says Display Filter, click that and change that to String so we can search for strings.
And on the left, look at the options in the open drop down box:
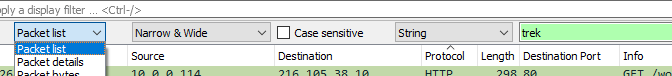
- Packet list will run a search through the entire Info column of the spreadsheet.
- Packet Details will run a search through the detailed pane (where we were creating columns from).
- Packet bytes will search the hex text at the very bottom.
Starting out, we are probably more interested in Packet list to search the Info column and Packet details for the detailed pane.
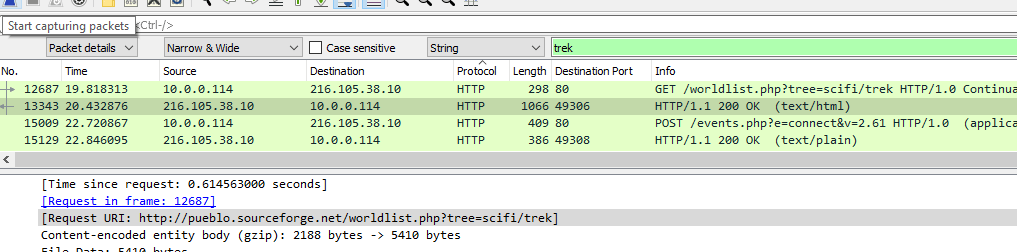
And here we can see a successful search for ‘trek’ in the details pane.
Filters
Starting out filters are intimidating because we have to go look through a long list of possible filters and try to decipher what filter is appropriate for use. Not fun.
Very basically, we can apply any protocol as a filter to zero in on that one particular protocol.
Or all we need to do is go search through the details pane and find one example of what we want, and right click, Apply as Filter → Selected. This will auto-populate the filter bar with the appropriate filter and apply it.
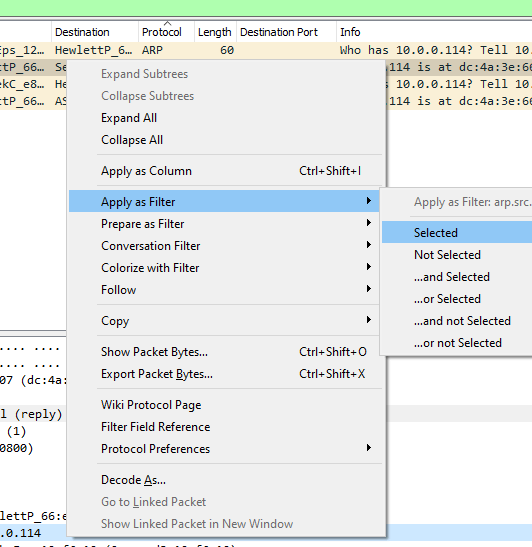
If you instead select Prepare as Filter instead of Apply as Filter, you can build a filter that auto-populates in the filter bar, keep adding to it with And Selected, Not Selected, etc., and then when you’ve finished building your filter, apply it. You don’t need to memorize or research the filter you want to use, just be able to find just one example of what you want.
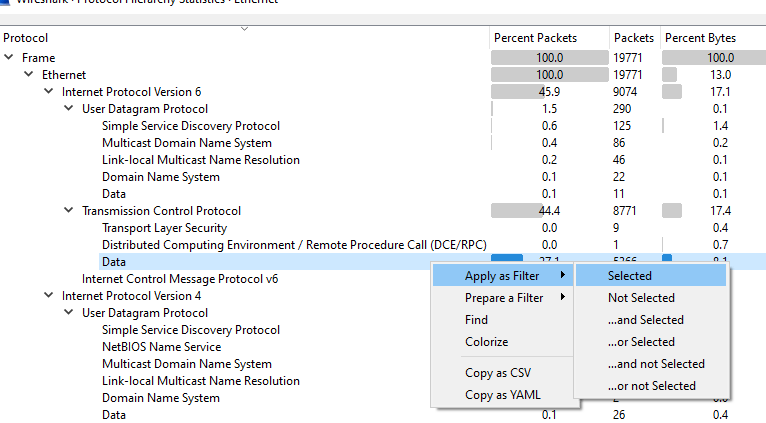
Statistics
The Statistics menu also gives some very nice high-level overviews of what is going on within the pcap.
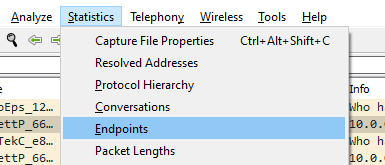
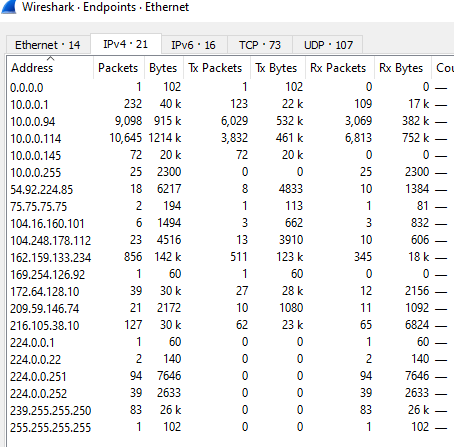
Endpoints will give a summary of, well, all of the endpoints, sources and destinations within the pcap.
And Protocol Hierarchy will give an overview of all of the different protocols.

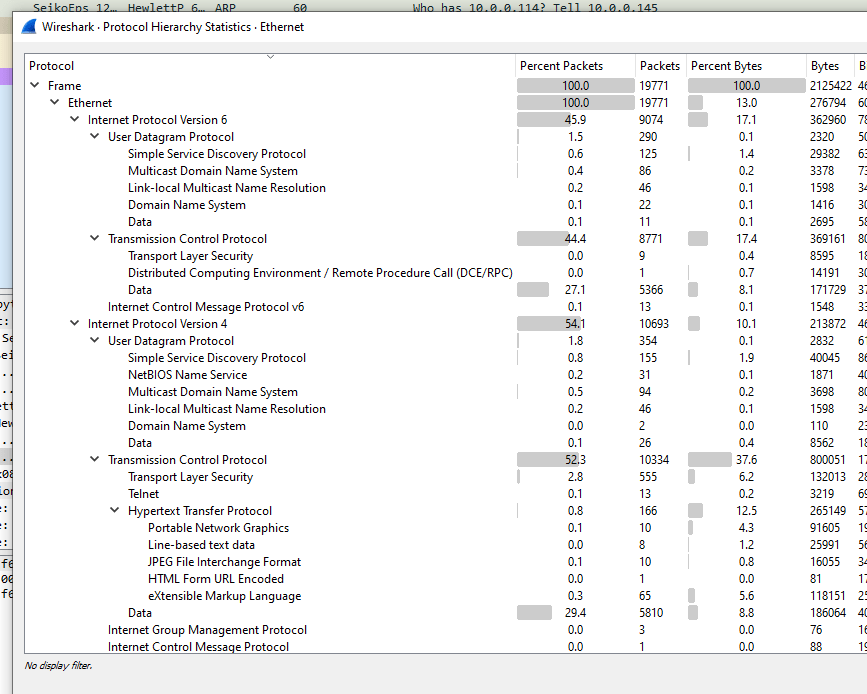
From all of these windows, you can also right click and create filters on the fly as well if you see something you would like to investigate further.
Every pcap is going to be a unique circumstance, so there is not going to be a one-size-fits-all solution nor a one-size-fits-all method of approach. If you’re unfamiliar with networking, as you browse through, get a sense of what is normal and expected behavior for this particular pcap. Any protocols you see listed, read up on it quickly in Wikipedia so you can see what that protocol is supposed to do. Any protocols listed, research quickly to see what known vulnerabilities exist that might be exploited and see if you see that behavior. I won’t lie — the more you know, the easier it gets, but if you invest in knowing Wireshark itself, this giant mess of information becomes suddenly much more plausible to sift through even when networking itself is still new. Good luck!
-ghostinth3machine

9 thoughts on “Spotting Anomalies in Pcaps”