
The Cyber Skyline Coach Dashboard is an invaluable tool when it comes to coaching for the National Cyber League (NCL) Games.
Let me start by listing the top 6 things that I use the Coach Dashboard for:
- Downloading all of the students’ scores for an event. (I use this for grading.)
- Quickly locating the top players by score for an event.
- Locating the lowest performing students for an event.
- Seeing when students started earning points in an event.
- For the Team Game, seeing how many points each student contributed to the overall team score.
- I like clicking into the report of each student to see where they did well and where they struggled per category.
From the Advisor Insights tab, select the event that you are interested in (e.g. NCL Fall 2020 Individual Game):
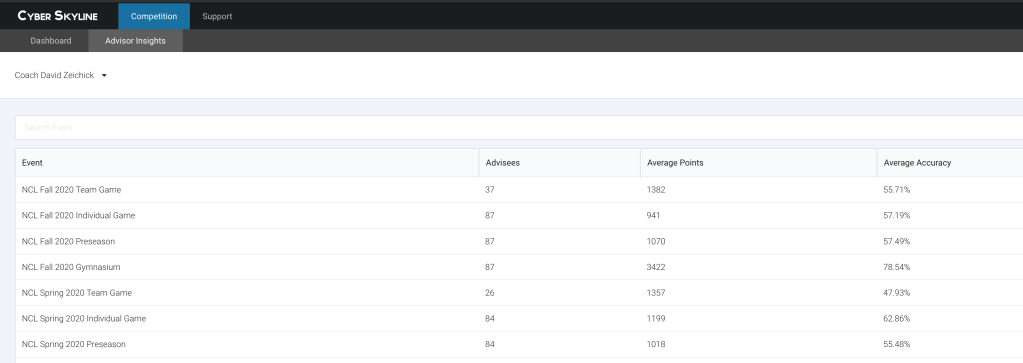
You should now see a graph of your Top Advisees Timeline and a list of your advisees:

To download all of your students’ scores, simply highlight the entire list and then paste it into a spreadsheet. (I usually use Excel.) Excel does a great job of keeping all of the columns separate.
You can also click on any of the headers in the Advisees section to sort. For example, if you want to see the list ordered by your lowest scoring to top scoring advisees, click on the Points column. Alternatively, if you want to see your top performers, click on the Points column again, and now it is in descending order with your top performers listed first.
To see when a student first started earning points on an event, click on the student whom you are interested in, which brings up the score report for that student. The Comparative Timeline displays a graph comparing the student’s score over time against the average of the top 25%, the overall average, and the bottom 25%. The student’s score is the blue line labeled “You” (yeah, a bit confusing, but you get the idea). Here, you can also see how the student did in each category of challenges.
If you want to see how many points a student contributed to their team, you would first select the Team Game that you interested in. This brings up a list of all of your teams. Click on one of the teams, and you should now see the Score Report for that team. Near the top of the screen, next to the students’ names, click on the Show Breakdown link. You should now see each student and how many points they scored.
Are there any features that you would like added? Leave a reply below.
